Hamilton, ON (May 1, 2023) –
The REALTORS® Association of Hamilton-Burlington (RAHB) reported 1,102 sales and 1,566 new listings in April. This marks the first time since early 2022 that the sales-to-new listings ratio pushed above 70 per cent. The increase in sales placed a strain on the pace of inventory growth, causing supply levels to trend down compared to earlier in the year. There were 1.6 months of supply available in April, and while this is a marked increase over peak pandemic levels, it is significantly less than the
Hamilton, Burlington and Oakville real estate agent. I know all too well the struggles that home buyers have been experiencing over recent years. It’s no secret that the residential real estate market has taken us on a wild ride over recent years and it finally appears that we are starting to see some consistency in market growth. Some neighbourhoods in the GTA have even seen their average sale price higher than the average list price for the first time since May 2022. The latest statistics suggest that the demand for property ownership will continue to grow due to the incredibly high rental prices which are becoming closer and closer to the cost of home ownership.

The March 2023 stats are in, last month we saw 6,896 sales in the GTA (down 36.5% compared to this time last year) with only a month and a half of inventory available, this points to a tighter market compared to last year. On a month-over-month basis, sales were up. The average price of a home (all types included) in the GTA was $1,108,606 in March 2023 compared to $1,095,617 in February 2023. However, when comparing year-over-year, the average sale price in the GTA across all home types was down 14.6% from $1,299,894 compared to last March, which was the peak of the market in 2022.
“As we moved through the first quarter, Toronto Regional Real Estate Board (TRREB) Members were increasingly reporting that competition between buyers was heating up in many GTA neighbourhoods. The most recent statistics bear this out,” said TRREB President Paul Baron. “Recent consumer polling also suggests that demand for ownership housing will continue to recover this year. Look for first-time buyers to lead this recovery, as high average rents move more closely in line with the cost of ownership.”
Let’s take a deeper look at some of the regional stats across the GTA, Toronto, Mississauga, Oakville, Durham Region, York Region and Brampton.
GTA Real Estate Market Stats
When looking at all home types in March 2023, the average sale price in the GTA was down 16.1% to $1,089,819 year-to-date, when compared to March 2022 (but up when compared to February’s $1,073,138). When zooming in on condos, prices were down 13% to $703,566 year-to-date, when compared to this time last year.
Toronto Real Estate Market Stats
When looking at all home types in March 2023, the average sale price in Toronto was down 11.4% to $1,046,656 year-to-date, when compared to March 2022 (but up when compared to February’s $1,038,434). When zooming in on condos, prices were down 11.8% to $732,944 year-to-date, when compared to this time last year.
Mississauga Real Estate Market Stats
When looking at all home types in March 2023, the average sale price in Mississauga was down 15.8% to $1,003,705 year-to-date, when compared to March 2022 (but up when compared to February’s $973,870). When zooming in on condos, prices were down 16.4% to $614,758 year-to-date, when compared to this time last year.
Oakville Real Estate Market Stats
When looking at all home types in March 2023, the average sale price in Oakville was down 15.9% to $1,527,827 year-to-date, when compared to March 2022 (but up when compared to February’s $1,490,074). When zooming in on condos, prices were down 9.5% to $811,418 year-to-date, when compared to this time last year.
Durham Region Real Estate Market Stats
When looking at all home types in March 2023, the average sale price in the Durham Region was down 23.4% to $905,175 year-to-date, when compared to March 2022 (but up when compared to February’s $887,800). When zooming in on condos, prices were down 19.7% to $560,118 year-to-date, when compared to this time last year.
York Region Real Estate Market Stats
When looking at all home types in March 2023, the average sale price in the York Region was down 14.6% to $1,318,479 year-to-date, when compared to March 2022 (but up when compared to February’s $1,296,659). When zooming in on condos, prices were down 11.8% to $698,057 year-to-date, when compared to this time last year.
Brampton Real Estate Market Stats
When looking at all home types in March 2023, the average sale price in Brampton was down 23.5% to $1,022,579 year-to-date, when compared to March 2022 (but up when compared to February’s $1,016,186). When zooming in on condos, prices were down 18% to $564,944 year-to-date, when compared to this time last year.
over three months of supply reported throughout most of the latter half of 2022.
“The gains in lending rates impacted sales across the RAHB market area, but we also saw a shift come from existing homeowners who were also reluctant to sell their home,” , RAHB President. “In April, new listings coming onto the market were much lower than levels traditionally seen at this time of year, keeping inventories relatively low in our market, and placing upward pressure on home prices.”
Low supply and increased sales are supporting an upward shift in prices in the region. In April, the unadjusted benchmark price reached $868,700, reflecting the fourth consecutive month prices have increased. Prices are still below the unprecedented highs seen during the peak in 2022, but provide some reassurance as to where prices will stabilize.
National Statistics
Demand continues to outpace supply as Canadian home sales jump in April
Ottawa, ON, May 15, 2023 – Statistics released today by the Canadian Real Estate Association (CREA) show national home sales jumped by double digits on a month-over-month basis in April 2023.
Highlights:
-
National home sales surged 11.3% month-over-month in April.
-
Actual (not seasonally adjusted) monthly activity came in 19.5% below April 2022.
-
The number of newly listed properties edged up 1.6% month-over-month but remain at a 20-year low.
-
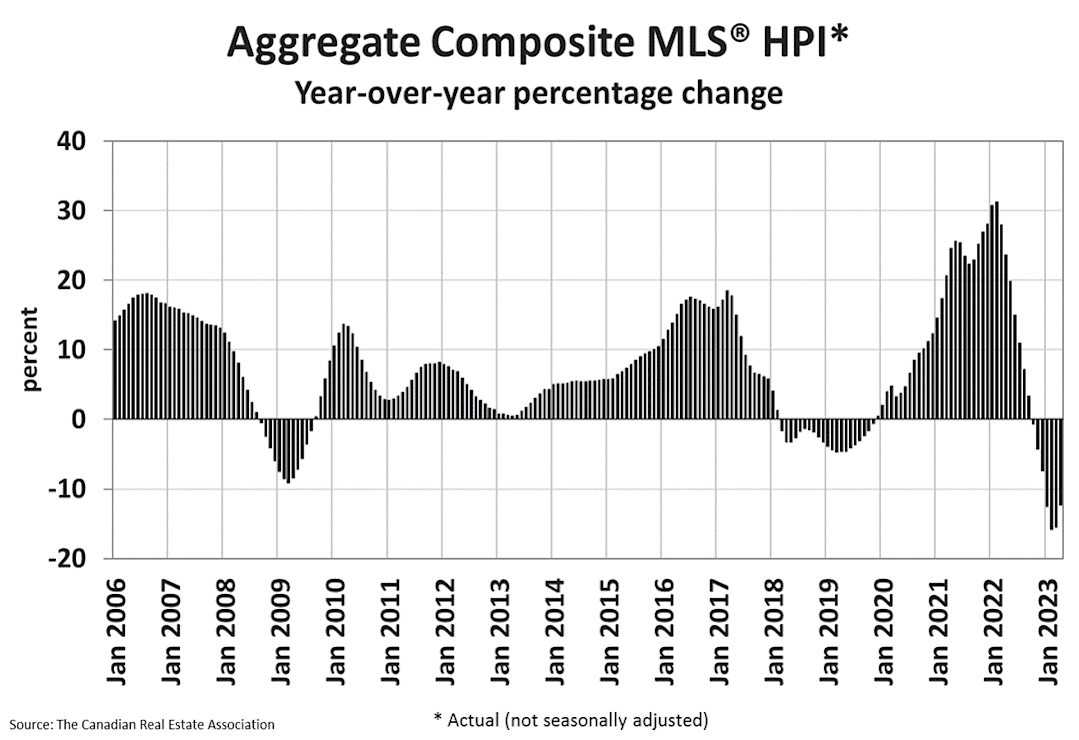
The MLS® Home Price Index (HPI) climbed 1.6% month-over-month but was down 12.3% year-over-year.
-
The actual (not seasonally adjusted) national average sale price posted a 3.9% year-over-year decline in April.
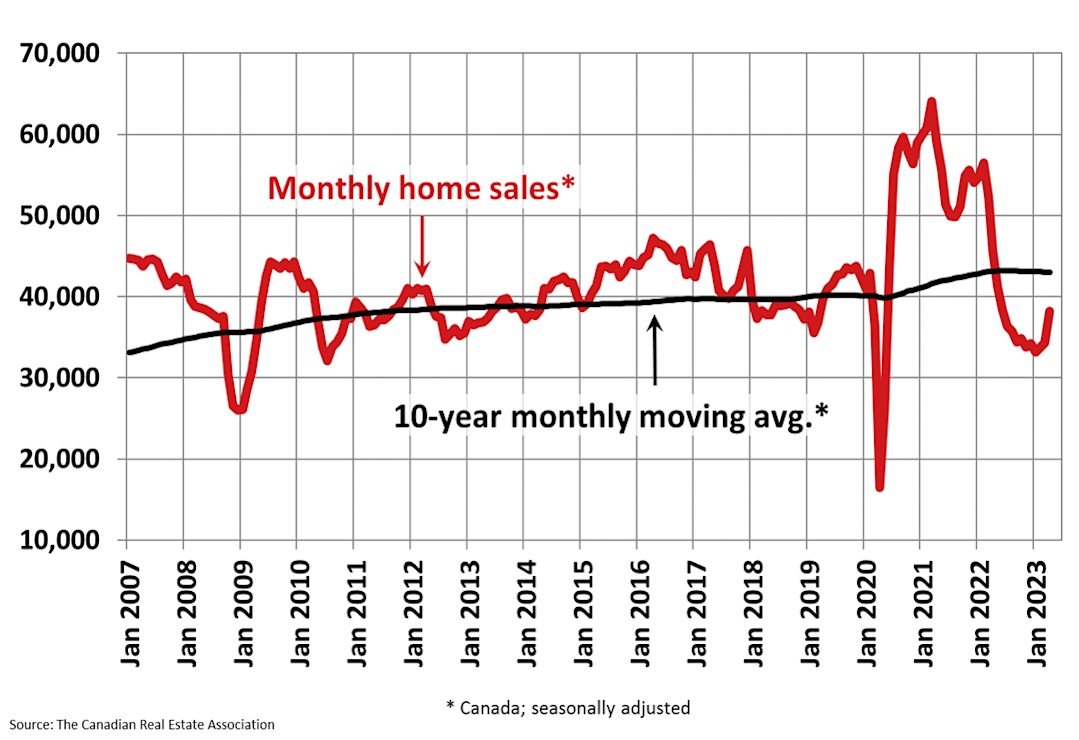
Home sales recorded over Canadian MLS® Systems posted an 11.3% increase from March to April 2023, foreshadowed by smaller back-to-back gains recorded in February and March. (Chart A)
Following the trend seen in recent months, the sales increase was broad-based but once again dominated by the B.C. Lower Mainland and the Greater Toronto Area (GTA).
Chart A
The actual (not seasonally adjusted) number of transactions in April 2023 came in 19.5% below April 2022, a markedly smaller decline than those seen over the past year.
“Over the last few months, there have been signs that housing markets were going to heat back up this year, so it wasn’t a surprise to see things take off after the Easter weekend, which often serves as the opener to the spring market,” said Hamilton, Burlington and Oakville real estate agent CREA’s 2023-2024 . “The issue going forward is not new: demand is once again returning at a scale that is outpacing supply. If you’re looking for information and guidance about how to buy or sell a property in this rapidly changing market, contact a REALTOR® in
your area,” continued
“With interest rates at a top, and home prices at a bottom, it wasn’t all that surprising to see buyers jumping off the sidelines and back into the market in April,” Economist. “Supply, on the other hand, has been sluggish, hence the price gains from March to April seen all over the country. Looking ahead, the first week of May did see a bit if a burst of new supply, suggesting some of those April buyers were existing owners now looking to sell their current homes. That could make for the kind of virtuous circle that might ultimately get more first-time buyers into the ownership space this year.”
The number of newly listed homes edged up 1.6% on a month-over-month basis in April; although, the bigger picture is that new supply remains at a 20-year low.
With sales gains vastly outpacing new listings in April, the sales-to-new listings ratio jumped to 70.2%, up from 64.1% in March. The long-term average for this measure is 55.1%
There were 3.3 months of inventory on a national basis at the end of April 2023, down half a month from 3.8 months at the end of March. The long-term average for this measure is about five months.
The Aggregate Composite MLS® Home Price Index (HPI) climbed 1.6% on a month-over-month basis in April 2023 – a large increase for a single month. It was also broad-based. A monthly increase in prices from March to April was observed in the majority of local markets.
Chart B
The actual (not seasonally adjusted) national average home price was $716,000 in April 2023, down 3.9% from April 2022, but up $103,500 from January 2023, a gain owed to outsized sales rebounds in the GTA and B.C. Lower Mainland. Excluding the GTA and Greater Vancouver from the calculation cuts more than $144,000 from the national average price.--
Home sales recorded over Canadian MLS® Systems posted an 11.3% increase from March to April 2023, foreshadowed by smaller back-to-back gains recorded in February and March. (Chart A)
Following the trend seen in recent months, the sales increase was broad-based but once again dominated by the B.C. Lower Mainland and the Greater Toronto Area (GTA).


Post a comment